
How can I measure the performance of my pricing actions?
📌 TL;DR
🎯 Measuring the performance of pricing actions is essential for effectively managing profitability.
📈 The choice of pricing strategies largely determines financial results and competitiveness.
🛍️ In retail, price communication strongly influences consumers’ perception of value.
🤖 Even if dynamic pricing is not yet in place, it is crucial to prepare for it in order to remain attractive and competitive.
🔍 Anticipating these developments allows you to adapt your pricing strategy to consumers who are sensitive to price variations.
Increased access to data now makes it possible to measure the performance of a pricing strategy across a wide range of indicators, and at a very granular level. We have identified three families of indicators that can be used to measure the performance of your pricing actions:
Financial indicators
These are the ones we immediately think of when we talk about measuring performance: growth, profit, sales, volumes, mass margin, unit margin rate, etc.
Competitive indicators
These indicators enable you to assess your company’s performance and positioning in relation to its competitors, for example by measuring price index, market share, etc.
Qualitative indicators
Other, more subjective indicators can be used to analyze pricing performance, sometimes using measurement methods such as customer surveys. More difficult to measure, a certain number of them can also enable you to assess your performance: customer satisfaction, price image, etc.
Measuring the performance of my pricing actions
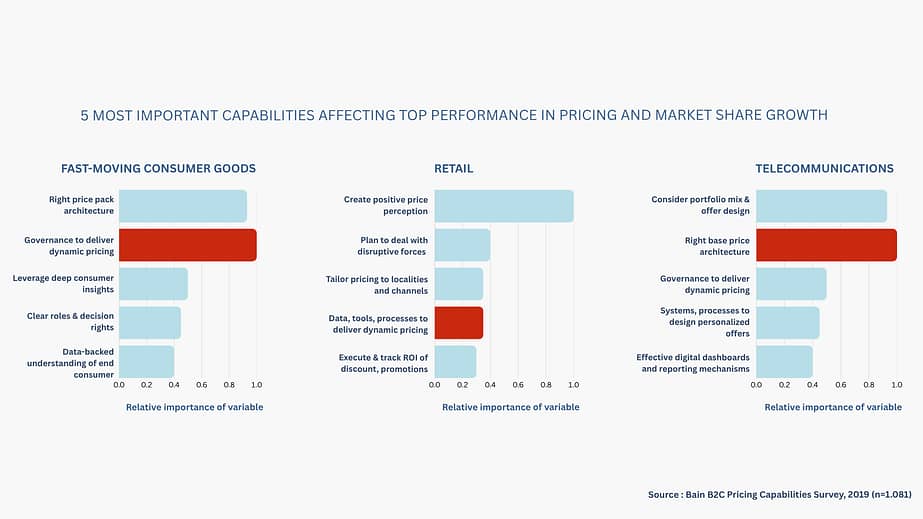
Choosing pricing strategies is a crucial step in evaluating a company’s performance. In the retail sector, the way prices are communicated to consumers plays a key role in how value is perceived and in optimizing results. Therefore, even if a dynamic pricing strategy has not yet been implemented in your product catalog, it is essential to actively prepare for it. Anticipating this change allows you to remain competitive in the market and maintain an attractive image among consumers who are increasingly sensitive to price variations. (source: Bain)
1. Why do I need to do this?
To make informed decisions
Measuring the performance of your pricing actions enables you to base your decisions on tangible data and adapt your pricing strategy accordingly.
Continuously improve results
By measuring the performance of your actions, you can easily identify which products and services are more or less successful, and take decisions to improve results. This information enables you to make adjustments to optimize your prices, and therefore your profitability.
Evaluate the profitability of your pricing project
Measuring the performance of your pricing actions enables you to determine whether they are producing positive results. You can then assess whether your strategy is having the desired impact, and whether your investment in people and tools is effective. You can then make adjustments to increase the profitability of your activities.
2. How do we do it?
At PricingHUB, we have developed a calculation to measure the value creation of the pricing actions implemented by our customers.
Our Data Science team has built the most relevant approach for our customers by eliminating the impact of seasonal variations, contextual variations, etc…
In order to propose the most relevant calculation possible, we compare the optimized group with the control groups. The optimized group is made up of optimizable products: a set of products and dates that receive the PricingHUB recommended price, while the control groups are ranges of products and dates that receive the “Customer Legacy Price”. The customer legacy price is the price established by the pricing teams according to their manual process, without any action on our part.
We then compare the results of the different groups on your performance indicators: sales, volume and profit. To arrive at a relevant calculation, we need access to historical data to i. define comparable products and ii. estimate performance without optimization. This enables us to measure and forecast the performance of the optimized group.
But how do we determine the control groups? We have three experimental methods at our disposal:
Definition of the control group based on part of your inventory
This method allows you to compare results over the same period of time. Each new price setting is applied to certain optimized groups and compared with other control groups.
In this case, the control groups are representative groups of products that are relevant in terms of performance and have the same characteristics (same category and same life cycle) as the products belonging to the optimized groups.
We calculate the performance of the control groups using the performance per demand compared with the previous year.
Time-based definition of the control group
This method enables us to compare the performance of identical SKUs over specific time periods. In this experiment, the optimized day is compared with two control days before optimization and two control days after optimization.
Traffic-based method (A/B test)
This method is theoretically the most accurate, but also the most difficult to implement, as it can only be carried out on an online catalog and requires high technical capacity. It enables random distribution of users arriving on a website/application, presenting them with different prices which can then be compared. At present, we have not had the opportunity to deploy it as described above. However, it is possible to use certain price chains (e.g. a store you don’t optimize) as a control group.
Whichever method you decide to implement for measuring your performance, we calculate the performance of the product groups optimized by our tool in relation to last year, and compare them with the performance of the control groups last year. In addition, we ensure that all data has been exposed to the same seasonality and contextual hazards.
Several options are available to ensure that results are not exposed to contextual hazards. We focus on two parameters:
Public holidays
We offer several options for public holidays, with the possibility of not excluding them, excluding them or excluding not only public holidays but also the days that follow or precede them.
Control days
We exclude certain control days depending on the context. Control days that are in a different context from the day for which value creation is calculated are not used in the calculation.
In this way, both methods of experimentation make it possible to compare actual performance with expected performance. The result is value creation, in both absolute and percentage terms. Discover our tool with one of our experts, make an appointment right here !